Class prep · TJ AP Human Geography

Read the map first,then make the argument.

A full AP Human Geography course for students taking it at TJ, often as a first AP class in 9th grade. It follows the College Board's seven units, with a short lesson on every topic and original practice: questions built on invented maps, charts and models, and AP-style free-response questions that use the task verbs (identify, describe, explain, compare). Every question has a worked answer. Built by Neil Kothari, a TJ alumnus.

$395 covers the full school year. The first module is free.

Try one. This is a test-level question from the course.

Problem 1

  • Test level
  • Multiple choice
  • No calculator
  • 4 pts

The isoline map shows mean annual rainfall on the fictional island of Orlund, with an isoline every 200 mm. Points P and Q lie 20 km apart on an east-west line. Points R and S also lie 20 km apart on the same line, farther east. Which conclusion is best supported by the map?

Isoline map of Orlund Island showing rainfall lines labeled 1200, 1000, 800, 600 and 400 millimeters running roughly north to south, closely spaced in the west and farther apart toward the east. Four labeled points P, Q, R and S lie along an east-west line, P and Q in the closely spaced western zone and R and S in the sparse eastern zone, each pair 20 kilometers apart.
Choose one answer

original questions, each with a worked answer
546
original questions, each with a worked answer
at test level or beyond
378
at test level or beyond
short lessons, one for every topic
42
short lessons, one for every topic
units, all open now
7
units, all open now

Free lesson

Lesson 1.1: Reading Maps and Choosing the Right One

How to pick the right kind of map for a question, read its scale and symbols correctly, and spot what it leaves out.

This lesson starts with three maps of one school lunchroom and builds from there.

Start with a question

Imagine you want to show a new student how your school cafeteria works.

  • You could draw a floor plan with the doors, the tray rack and the cash registers.
  • You could draw a dot for every student standing in line at 12:10.
  • You could draw arrows from each table to the pizza counter, thicker where more people walk.

Same room, three maps. Each one answers a different question. None of them shows everything.

That is the big idea of this lesson. A map is a simplified picture of a place, made for a purpose. Every map keeps some things and throws others away. Your job as a geographer is to ask three things: what is this map for, what does it show, and what does it leave out?

By the end of this lesson you will be able to:

  • name the six common thematic map types and match each one to the kind of question it answers,
  • tell a total from a rate, and turn counts into a density so areas can be compared fairly,
  • use a map scale to turn map distance into ground distance, and say which of two maps is larger scale,
  • read isolines, proportional circles and cartograms without falling for their built-in traps,
  • explain what a projection distorts and what any map hides.

Reference maps and thematic maps

A reference map shows where things are: roads, towns, rivers, borders. A road atlas is a reference map.

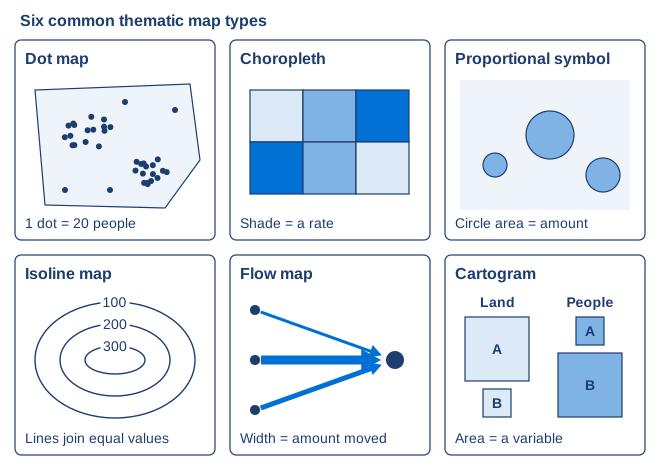
A thematic map shows the pattern of one topic, such as rainfall, population or commuting. Most maps you will meet in this course are thematic. They come in six main types.

Six small panels showing a dot map, a choropleth, a proportional symbol map, an isoline map, a flow map and a cartogram, each with a one-line rule

Map typeWhat you seeBest forThe trap
Dot mapOne dot per thing, or per fixed number of thingsWhere things cluster or spread outDots can pile up and hide each other
ChoroplethEach area shaded by one valueA rate or ratio, such as percent or people per km²Raw totals make big areas look important
Proportional symbolA circle sized by a value at a placeAmounts at points, such as visitors to a museumCircles drawn by diameter exaggerate
IsolineLines joining places with equal valuesThings that change smoothly, such as elevation or rainfallReading line spacing as the value itself
Flow mapLines or arrows between places, width shows amountMovement of people, goods or moneyIt shows how much, not why
CartogramEach area resized by a variable, not by landComparing countries by population or wealthReading the big shapes as big land areas

Here is the rule to remember for a choropleth. A total is a plain count, such as 5,000 people. A rate divides by something, such as people per square kilometer or percent of households. Totals tend to be big wherever the area is big or many people live. Rates correct for that, so they let you compare areas fairly.

Three habits for reading any map

  1. Read the title and the legend first. They tell you the topic, the unit, the place and what dark and light mean.
  2. Ask whether the value is a total or a rate. If it is a total on a choropleth, be suspicious.
  3. Ask what is hidden. A choropleth gives a whole area one shade, so it hides differences inside it. A flow map hides why and when people moved.

Worked example 1: match the question to the map

A city transit office has four questions. Pick a map type for each.

  1. "Where exactly are the bus stops?" Each stop is one point and the question is about location. Dot map (or a reference map).
  2. "Which neighborhoods have the highest share of households without a car?" A share is a rate for each area. Choropleth.
  3. "How many riders board at each of the eight train stations?" These are amounts at points. Proportional symbol map.
  4. "How many commuters travel from each suburb to downtown?" This is movement between places. Flow map.

Check: for each answer, ask whether the data are points, areas, amounts or movements. Points went to the dot map, rates for areas to the choropleth, amounts at points to circles and movements to arrows. Every match lines up.

Quick check 1. A news site wants to show which states have the highest percent of adults with a college degree. Which map type fits best, and why?

Problem 2

  • Core
  • True or false
  • No calculator
  • 2 pts

True or false: The statistics office of Valdoria wants a choropleth map (a map that shades each area by the value of one variable) showing how crowded each district is. District Marlow has 9,000 residents on 300 square kilometers, and district Tesk has 4,000 residents on 50 square kilometers. Shading the districts by raw number of residents would be a poor choice, because Marlow would look more crowded than Tesk even though Tesk is more densely settled.

Is the statement true or false?

Problem 3

  • Core
  • Multiple choice
  • No calculator
  • 4 pts

A cartographer for the fictional world of Ostra uses an equal-area projection. Near the left and right edges of the map, east-west distances are stretched by a factor of 1.51.5, and north-south distances are shrunk so that areas stay true. Two circular lakes, Lake Pim at the center of the map and Lake Quay at the right edge, each have a real diameter of 60 km60\ \mathrm{km}. Which statement best describes how they look on the map?

Choose one answer

Open the rest of this lesson, free

The full lesson and all 13 of its questions, with every worked answer.

I am aI am a

Your free lesson opens right here, on this device for 30 days. We'll email you occasional TJ class prep updates. Unsubscribe anytime.

How it works

Class prep that works alongside class

A full AP Human Geography course for grades 9 to 12. It works well alongside a school course and also stands on its own. Students new to AP learn how the questions are built before they have to answer them. Students who feel behind rebuild a topic with the lesson before they try the practice.

  • Every question is original and built on an invented map, chart or model: true or false, multiple choice, multi-part and free response.
  • Each one is marked core, test level or beyond.
  • Free-response questions use the task verbs, such as identify, describe, explain and compare, and the worked answer shows what a complete response includes.
  • A worked answer for every question, ending with the mistake that most often costs points.
  • A lesson on every topic, with a map, chart or model wherever a picture makes the idea clear.

What is inside

  1. 1Thinking Geographically6 lessons · 78 questions
  2. 2Population and Migration6 lessons · 78 questions
  3. 3Cultural Patterns and Processes6 lessons · 78 questions
  4. 4Political Patterns and Processes6 lessons · 78 questions
  5. 5Agriculture and Rural Land Use6 lessons · 78 questions
  6. 6Cities and Urban Land Use6 lessons · 78 questions
  7. 7Industrial and Economic Development6 lessons · 78 questions
The front entrance of Thomas Jefferson High School for Science and Technology
Neil Kothari, co-founder of EduAvenues

Who built it

Neil Kothari

TJHSST alumnus · Co-founder, EduAvenues · 10+ years in TJ preparation

Neil is a TJ alumnus and has spent more than a decade working with TJ students and their families. He built this course so students can practice reading maps and data and writing clear answers together. Every question is written for the course and every answer is checked before it goes in.

Tuition

$395for the full school year

One tuition covers every unit of the course. All 7 units are open now. The Reading Maps and Choosing the Right One lesson stays free for everyone.

  • All 7 units: 42 lessons and 546 original questions
  • A worked answer for every question
  • Access through the end of the school year
Enroll